The Current Economic Development (CED) index summarizes six key macro statistics for 42 countries and the Euro area. It focuses on the short-run development and documents which nations are currently doing well and which are struggling.
The CED index considers GDP growth, inflation, unemployment, the public budget balance, the current account balance, and the exchange rate.
All six components are weighted equally, reflecting the fact that there are trade-offs: improvements in one component can come at the price of a deteriorating performance in another variable. This website explains the crucial trade-offs to keep in mind.
The Latest News – July 2024:
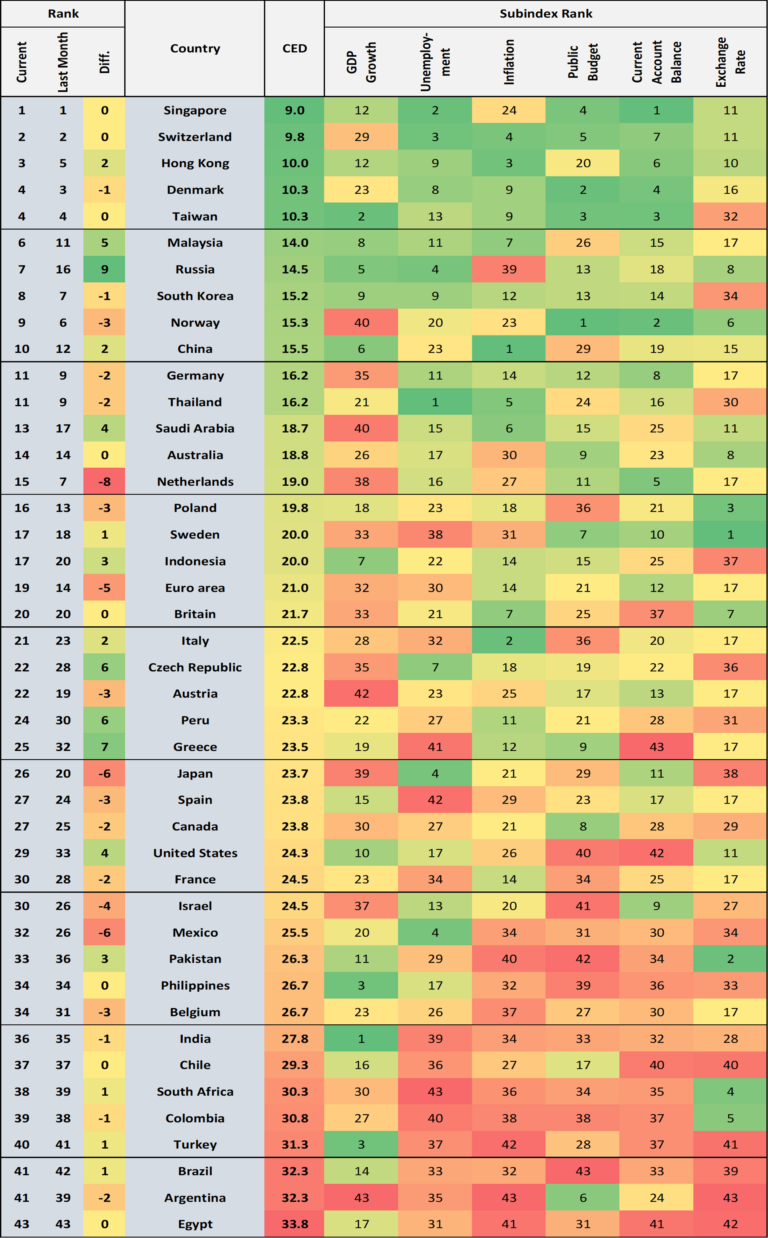
Singapore defends the top spot.
Switzerland, Hong Kong, Denmark, and Taiwan complete the top-5.
Netherlands and (again) Mexico fall the most, eight and six ranks respectively.
Russia is up 9 ranks, now 7th overall.
The US ranks 29th. It trails both China (10th) and the Euro area (19th).
Egypt is still at the bottom of the ranking.
The Current Ranking – as of July 4, 2024
The current ranking based on six macroeconomic indicators:
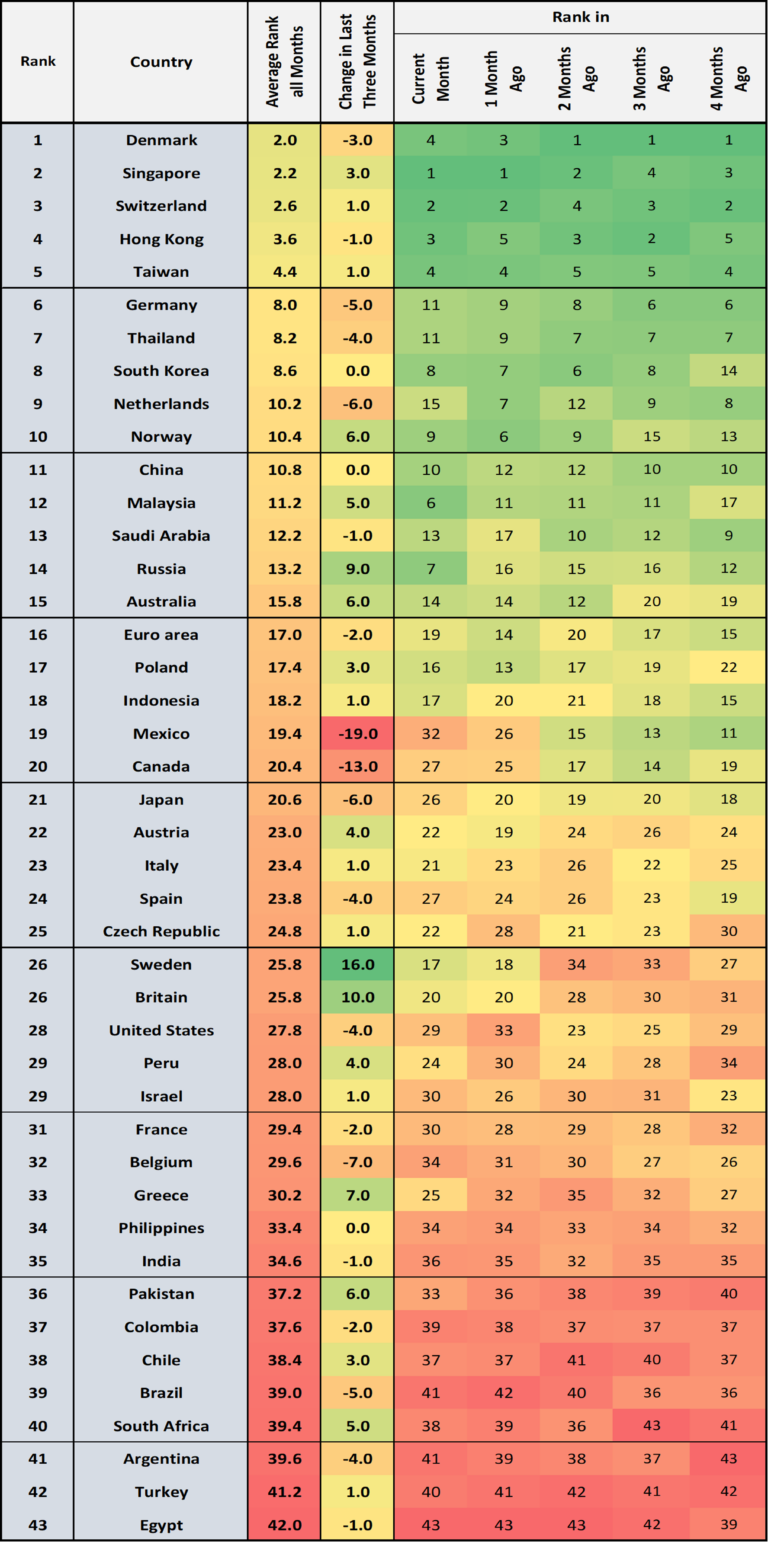
Ranking over Time
What matters more than the current ranking position of a country is its performance over time. Hence, below you find each country’s ranking position of the past and present. The countries are sorted by their average CED rank over time. The latest month is July 2024.
Methodology
The CED index considers the latest available data on six macroeconomic variables:
GDP (% change on year ago)
Consumer price inflation (% change on year ago)
Unemployment rate (in %)
Public budget balance (% of GDP)
Current account balance (% of GDP)
Exchange rate to the US Dollar (% change on year ago)
On each macro variable, the countries are ranked. It is best to have high rates of GDP, low inflation and unemployment rates, a positive public budget & current account balance, and an appreciating currency against the US Dollar.
All six components are weighted equally, reflecting the fact that there are trade-offs. Expansionary fiscal and monetary policy, for instance, can lower unemployment and foster GDP growth but can come at the price of higher inflation and a larger public deficit.For the calculation of the CED index, the average rank across all six macroeconomic subindices is computed.
The Six Macroeconomic Indicators
The text below briefly explains the seven macroeconomic indicators that contribute to the overall CED ranking of a country. It also points out additional variables and key trade-offs to bear in mind.
Gross Domestic Product (GDP)
This is the main indicator economists keep track of. It summarizes the economic activity within a country. Put simply, it is equal to a nation’s total economic production, its total economic income, and the total spending on the goods and services it produces. All three must be (more or less) equal because everyone’s spending is someone else’s income.
Usually, GDP is measured using the spending approach: the sum of private consumption, private investment, government spending, and net exports. Formally, GDP = C + I + G + NX.
This shows how governments and central banks can boost GDP in the short-run by increasing government spending, cutting taxes (e.g., to foster private consumption), or by cutting the interest rate to stimulate private investment. Moreover, GDP can grow rapidly for some time after a steep recession (so-called base effect).
The short-term up and down of GDP is less important than its long-term development. Economists usually argue that GDP grows over decades if there is a growing working-age population that is equipped with better machinery & infrastructure as well as higher technology.
When expressed per person, GDP per capita is a strong predictor of a country’s life expectancy, happiness, access to education, and many other desirable objectives.
Consumer Price Inflation
High rates of inflation erode the functioning of money. In modern economies, money is used to facilitate economic transactions, to provide a unit of account, and to store value. Inflation causes money to perform worse along all three functions. A detailed account of the effects of inflation is found at the European Inflation Tracker.
Unemployment Rate
A country ideally uses most of its available labor force, not leaving people involuntarily unemployed. Lower rates of unemployment provide multiple benefits such as a higher production capacity or a better negotiating position for workers.
Public Budget Balance
All governments have tax revenue and expenditures, the difference between the two determining the public budget balance. While economists discuss whether governments should always run a balanced budget (revenue = expenditures), a large public deficit implies a rising public debt. This must sooner or later be paid for – either by raising taxes or by inflating away the public debt.
Current Account Balance
The current account consists of two components: exports and imports of goods and services as well as international transfers (e.g., dividends). A country runs a current account surplus if it has more exports than imports of goods and services or if the incomes received from abroad outweigh the incomes paid to foreigners.
Nations with a balanced current account can fund their purchases themselves. Put differently, the current account reflects the overall borrowing needs of a nation. If a country has a current account deficit, it needs a foreign country to lend it the equivalent amount of the deficit. As a result, the country’s Net International Investment Position (NIIP) changes according to its current account. A current account surplus improves the NIIP, which is why such surpluses are generally considered a positive sign. The surplus also creates upward pressure on a country’s currency – that is, the currency is likely to appreciate.
Exchange Rate
Each country’s currency can either appreciate or depreciate against the US Dollar. In the former case, imports such as oil or other commodities get cheaper: you need fewer units of the domestic currency to buy one US Dollar.
Citizens of a country with an appreciating currency become more prosperous in an international comparison. When going on vacation, for example, they can afford more. Typically, an appreciating currency lowers inflation because imported goods (often traded internationally in US Dollar) get cheaper. The downside to a strong currency is that exporting firms come under pressure as their products become more expensive to foreign customers. Yet, a nation’s central bank can relatively easily weaken the own currency – while the opposite is much harder.
The Data
All underlying data are taken from the renowned weekly magazine The Economist.
As with all data, there are some caveats to bear in mind:
Unemployment rates are measured differently across countries. Furthermore, people can drop out of the labor force altogether. Then they are no longer counted as unemployed. As a complementary statistic to the unemployment rate, it is thus worthwhile to watch the employment rate as well: the share of working-age people that actually have a job.
Consumer price inflation is measured differently across countries. Basically, statistical offices track over time the prices of goods and services that consumers buy. Each category (like food or transportation) makes up a fraction of total spending. However, what fraction people spend on, for instance, food differs widely across countries. As a result, if food prices go up in global markets, this has a very different effect on the national rates of inflation.